The Stack Overview provides a broad overview of data for the Stack, along with Visualisations to model the data that provide helpful insight and Participant data for all Participants across the Stack.
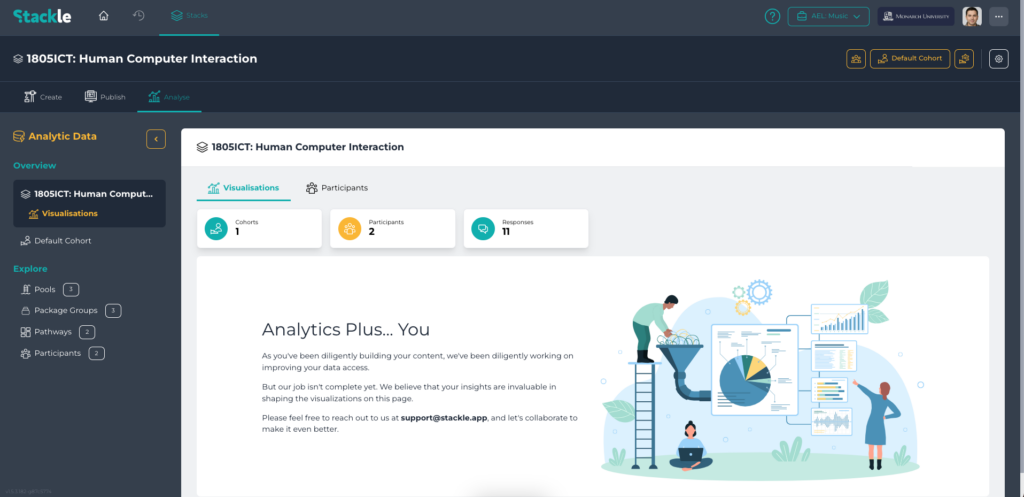
View of Stack Overview in Analytics Plus
Visualisations #
Visualisations are graphical representations to grant useful insight into your data. Visualisations are still being implemented, however, we are looking for valuable insight from the Stackle community. Please feel free to reach out to us with your suggestions.

Participants #
The Participants list in Stack Overview displays all Participants that belong to the Stack.

Search Functionality: Use the Search Functionality available to narrow down the list of Participants. You can search either the Name or Email of the Participants using the ‘Search Term Selection Box’. Enter relevant details into the textbox and click the ‘Search’ button to narrow down the list. Use the ‘Clear Results’ button to remove any currently applied search terms.
‘Download Report’ button: Click this button to create an export of the Participant list.
Name: Displays the name of the Participant.
Email: Displays the email address of the Participant.
Last Cohort: Displays the Cohort the Participant was last linked to.
Cohorts: Displays the total number of Cohorts the Participant is linked to. (A participant is usually a member of just one cohort in a Stack, but may be in more than one, e.g. if they repeat a course.)
Questions: Displays the total number of Questions the Participant has provided a response for in the Stack.
Responses: Displays the total number of responses provided by the Participant in the Stack.
Last Response: Displays the date the last response was provided by the Participant.
‘Participant Analytics’ button: Click this button to jump to viewing the Participant in ‘Explore – Participants’.